There is no shortage of articles on tips and tricks for improving Google Analytics. This article, however, will focus on using Google Analytics for its main purpose: driving continuous improvement in your business.
Continuous improvement boils down to tracking the key metrics of your business to identify problems and successes. To help, I’ve assembled a Data Studio template tailored to ecommerce. Readers can copy the template and add a Google Analytics data source. Both are explained in the instructions on page 1.

Users can copy the Data Studio from the page 1 overview. It also includes instructions for adding a data source.
The remaining pages provide key reports for comparing year-over-year performance. The Overview on page 2 shows the primary ecommerce KPIs:
- Sessions,
- Revenue,
- Conversion rate.

The overview on page 2 shows the three primary ecommerce KPIs: Sessions, Conversion rate, Revenue.
The reports that follow the overview compare year-over-year changes:
- Channel Performance,
- Source/Medium Performance,
- Device Performance,
- Advertising Performance.
Monitor sudden shifts in any of the metrics, which could result from (i) promotions, (ii) price changes, (iii) website updates, (iv) competitor initiatives, and (v) inventory adjustments.
Channel Performance. The Channel Performance report on page 3 provides a year-over-year snapshot of sessions, conversion rate, and revenue by channel.

The Channel Performance report provides a year-over-year snapshot of sessions, conversion rate, and revenue by channel.
If performance is up or down overall, is it trending the same way for all channels? Or are certain channels performing better than others? Focus on the channels that have the biggest impact on overall revenue.
Source/Medium Performance. To drill down into each channel, use the Source/Medium Performance report on page 4. Add dimensions by channel for a deeper dive.

Use the Source/Medium Performance report the drill down into each channel.
The channels worth exploring for ecommerce are typically (i) paid search, (ii) organic search, (iii) referral, and (iv) social media. Your business may have others.
Again, focus on the sources that have the most impact on your revenue and those with the biggest gain or loss year-over-year.
Device Performance. When comparing historical data, review the Device Performance report on page 5. The report includes the ability to graph over time by device category and select other metrics besides the default conversion rate, such as sessions and revenue.

The Device Performance report includes the ability to graph over time by device category.
Are certain devices performing better or worse than others? Look, especially, for how mobile is performing to help determine if the mobile experience on your website needs attention.
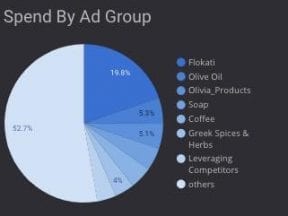
Advertising Performance. If you use Google Ads, Microsoft Advertising, or others, use the Advertising Performance report on page 6 to monitor performance.

Use the Advertising Performance report to monitor performance for Google Ad, Microsoft Advertising, and others.
I’ve filtered the Advertising Performance report to include only sources with ad spend in the timeframe reported. Adjust the filter, if needed, for your business. I’ve addressed how to import advertising cost data other than Google Ads at “Using Google Analytics to Optimize Bing Ads, Other Channels.”
Other Reports
Product Performance report on page 7 lists top products by revenue and compares several metrics to last year, including (i) product detail views, (ii) product adds-to-cart, and (iii) product revenue.
Do the “detail views” and “adds-to-cart” align with revenue shifts? Are shoppers abandoning after viewing or adding to cart? Are you capturing and populating metrics such as product adds-to-cart?
If product sales are down, investigate (i) lower demand overall for the product, (ii) increased competition, (iii) price changes, and (iv) less promotion.
Landing Page Performance report on page 8 is available for year-over-year reporting. Landing pages have a significant impact on conversion rates.
Use the default channel grouping and device category filters to slice and dice the data if downward (or upward) trends are discovered. This report can be handy if the Product Performance report on page 7 identifies big drops (or increases) in sales for certain products. Does the landing page for an affected product see a similar shift in sessions, conversion rate, and revenue?
Purchase funnel reports. The Shopping Performance report on page 9 and the Checkout Performance report on page 10 allow merchants to analyze the purchase funnel. I’ve applied filters to each report that may need modifying for your use.
The purpose of both reports is to look for year-over-year shifts in the path to purchase. For example, using the Shopping Performance report you can compare March 2021 to March 2020. If certain steps have more abandons, investigate potential site changes for the cause. If the data is not available, add the tagging.
The Checkout Performance report identifies where shoppers are abandoning after adding to cart. If certain checkout steps have high abandonment, look for ways to reduce the friction.
Customizing the Template
Your KPIs may differ from what I’ve included. Additional metrics could include:
- Average order value,
- Users (instead of page views),
- Bounce rate,
- Average session duration,
- Pages per session,
- Geo-based dimensions (regions or countries),
- Campaigns (such as paid search and display),
- Keywords (for pay-per-click campaigns),
- Goals such as leads, contact form submits, phone calls,
- Product average price.